
Correlation vs Causation: Real-Life Examples That Reveal the Difference
Correlation vs causation examples are everywhere — in health headlines, social media feeds, and psychology research papers. A correlation tells you that two variables move together; causation tells you one actually produces the other. These are not the same thing, and treating them as if they were leads to bad science, flawed policy, and decisions that can cause real harm. Understanding the difference is one of the most practically useful skills that comes out of studying psychology.
Key Takeaways
- Correlation only tells you two variables are related — it says nothing about which one causes the other, or whether any causal link exists at all.
- The third variable problem is one of the biggest reasons correlational findings mislead us; a hidden factor can drive changes in both variables at once.
- Spurious correlations are statistically real but meaningless — they illustrate how easy it is to find patterns in data that have no causal logic whatsoever.
- The directionality problem means we often cannot determine which variable came first, making it impossible to assign cause from correlational data alone.
- Causation requires controlled experiments, longitudinal designs, and replication — not just a strong correlation coefficient.
What Correlation and Causation Actually Mean
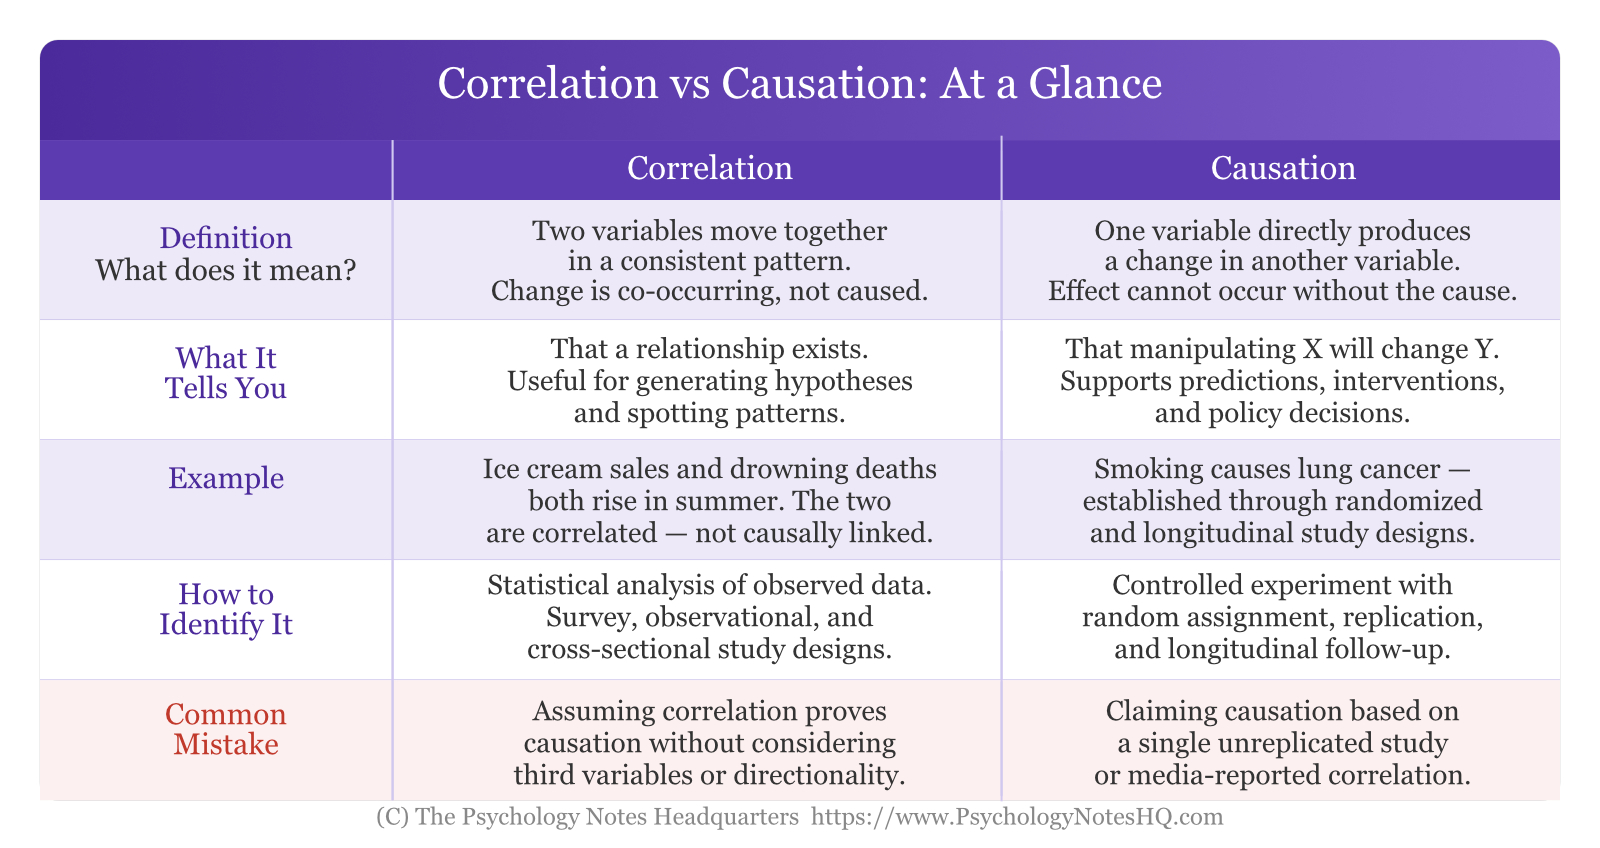
A correlation is a statistical relationship between two variables: as one changes, the other tends to change as well. A positive correlation means both variables increase together — study time and grades, for instance. A negative correlation means one increases as the other decreases, like perceived stress and sleep quality. A zero correlation means there is no consistent relationship between the two variables.
Causation is a different and considerably stronger claim. For one variable to cause another, three conditions must be met: the variables must be correlated, the cause must precede the effect in time, and all other plausible explanations must be ruled out. That third condition is far harder to satisfy than it sounds, which is why researchers invest so much effort in designing controlled experiments rather than simply observing naturally occurring patterns.
Correlation is relatively easy to detect. Causation takes considerably more work — and far more rigorous methodology — to establish. Keeping that distinction clear is what separates careful scientific reasoning from the kind of causal storytelling that fills news feeds and misleads the public on a daily basis.
Why Mixing Them Up Comes So Naturally
The human brain is exceptionally good at detecting patterns. This is an evolutionary advantage, not a flaw. Ancestors who quickly noticed that certain plants appeared near safe water sources, or that certain sounds preceded danger, survived longer than those who missed the patterns. The problem is that this pattern-detecting machinery doesn’t come with a built-in warning that reads “correlation only — causal interpretation not included.”
This tendency gets compounded by a well-documented cognitive bias: we tend to notice and remember information that confirms what we already believe while overlooking or discounting evidence that complicates the picture. If you already suspect that social media causes depression, your brain is primed to latch onto every study showing a link between the two and to skip over the ones that qualify or contradict it. What starts as a reasonable hypothesis calcifies into a firmly held conviction, often with a single correlational finding as its entire evidential foundation.
Media coverage makes this significantly worse. A headline like “Children Who Eat More Candy Perform Worse in School” is almost certainly reporting a correlational finding, but the sentence structure implies causation. Journalists are not necessarily being dishonest — storytelling requires clear cause-and-effect structure, and “these two variables were found to co-vary, possibly due to a range of unmeasured confounds” is not a headline that drives traffic. The result is that misleading examples of correlation vs causation in real life circulate continuously, absorbed uncritically by audiences who have no reason to question them.
Correlation vs Causation Examples in Psychology Research
Some of the clearest correlation is not causation examples come from psychology research itself — a field that relies heavily on survey data, self-report measures, and observational study designs that, by their nature, cannot establish causation.
Take the widely discussed link between screen time and adolescent depression. Twenge and Campbell (2018) found a statistically significant association between high screen time and lower psychological well-being in a national sample of over 40,000 children and adolescents in the United States. The finding was meaningful and has attracted significant policy attention. But it was correlational. It remains entirely plausible that adolescents who are already experiencing depression and loneliness gravitate toward heavier screen use as a coping mechanism — in which case, the depression preceded the screen behaviour rather than resulting from it.
A second classic example is the relationship between stress and physical illness. Cohen, Janicki-Deverts, and Miller (2007) reviewed robust evidence linking chronic psychological stress to a range of disease processes, including cardiovascular disease and immune dysfunction. The relationship is well-replicated. And yet stress researchers have had to work carefully to disentangle genuine causal effects from the dense web of third variables — socioeconomic status, pre-existing health conditions, sleep disruption — that correlate simultaneously with stress and with poor health.
A third example is social support and health. People with larger and closer social networks consistently show better physical and mental health outcomes (House, Landis, & Umberson, 1988). But does social connection protect health, or are people who are already healthier and more psychologically stable simply better positioned to build and sustain relationships? Even decades of research on this question have not produced a fully settled answer. Understanding learned helplessness in clinical populations involves similar challenges: the correlation between perceived control and health outcomes is clear, but tracing the direction of causality requires far more than a correlation coefficient.
The Third Variable Problem: The Hidden Culprit
The third variable problem is arguably the single most important concept for evaluating psychological research. It refers to the situation in which a third, unmeasured variable is actually driving the apparent relationship between two measured variables, making them look causally connected when they are not.
The most widely cited illustration is ice cream sales and drowning deaths. The two track together across the calendar year — both peak in summer and drop in winter. Without further thought, you might wonder whether something about ice cream consumption puts people at risk. The actual explanation, of course, is a third variable: warm weather and the summer season drive both simultaneously.
Another clean example is shoe size and reading ability in primary school children. These two variables are genuinely correlated. Children with larger feet do tend to read better. But children who read well are not doing so because of their feet. Age is the third variable — older children have larger feet and have also received more years of reading instruction.
In psychology, socioeconomic status functions as one of the most pervasive third variables. Studies examining neighbourhood characteristics — greenspace, noise, housing quality — and mental health consistently find correlations. But all of these neighbourhood factors are themselves correlated with poverty, which independently predicts poor mental health through chronic stress, limited healthcare access, and food insecurity. Failing to account for socioeconomic status as a third variable can make it appear that surface-level environmental features are shaping wellbeing, when the underlying driver is financial precarity.
Pearl and Mackenzie (2018) describe the lurking variable problem as one of the fundamental obstacles to causal reasoning — a challenge that centuries of statistical analysis failed to resolve until the development of formal causal inference frameworks in recent decades.
Spurious Correlations: When the Data Is Technically Correct but Completely Misleading
Tyler Vigen built a website and then a book out of a deceptively simple idea: if you mine large enough datasets, you can find a strong statistical correlation between almost any two variables (Vigen, 2015). The results are comically memorable examples of spurious correlation.
The number of films Nicolas Cage released in a given year correlates highly with the number of swimming pool drowning deaths in the United States. Per capita cheese consumption correlates with deaths from bedsheet tangling. Divorce rates in Maine track closely with per capita margarine consumption. Each of these is a genuine example of spurious correlation — statistically real relationships with absolutely no causal mechanism connecting them. Both variables happen to trend in similar directions over time for completely independent reasons. The correlation coefficient is accurate; the causal interpretation is absurd.
What makes examples of spurious correlation in the media particularly problematic is that they don’t always look as obviously ridiculous as the Nicolas Cage case. When a news article notes that organic food sales have increased at roughly the same rate as autism diagnosis rates over the past two decades, it sounds vaguely plausible. Both trends are real. But diagnostic criteria changed, parental awareness grew, reporting practices shifted, and numerous other factors also changed during the same period. The correlation says nothing about cause.
The halo effect operates similarly in social perception — one impressive-sounding data point lends unwarranted credibility to broader conclusions. A single confident-sounding correlation can shape public belief on a topic for years if it reaches the right audience without appropriate context about what it does and does not show.
The Directionality Problem: Which Came First?
Separate from the third variable problem is the directionality problem — the fact that even when two variables are genuinely related to each other, correlational data often cannot tell us which one is driving the other.
The social media and depression question illustrates this clearly. Multiple studies have found a link between heavy social media use and depressive symptoms in adolescents. But cross-sectional data, collected at a single point in time, cannot determine whether increased social media use is contributing to depression or whether adolescents who are already experiencing depression are spending more time on social media as an outlet for connection and distraction. Longitudinal studies tracking the same individuals over time have found evidence pointing in both directions, suggesting the relationship may be genuinely bidirectional.
The same problem applies to self-efficacy and academic performance. Research consistently finds a positive correlation between students’ belief in their own ability and their academic outcomes — people with higher self-efficacy tend to achieve more. But does self-efficacy drive achievement, or does successfully achieving things build self-efficacy? Bandura (1997) described the relationship as involving reciprocal determinism, in which both variables influence each other in an ongoing cycle. That understanding came not from simply observing that the two were correlated, but from years of carefully structured experimental and longitudinal research designed to probe the direction of influence.
Correlation vs causation examples in real life are frequently caught in exactly this kind of bidirectional tangle — both variables are real, the relationship is real, and the causal direction is still genuinely unclear.
How Researchers Actually Establish Causation
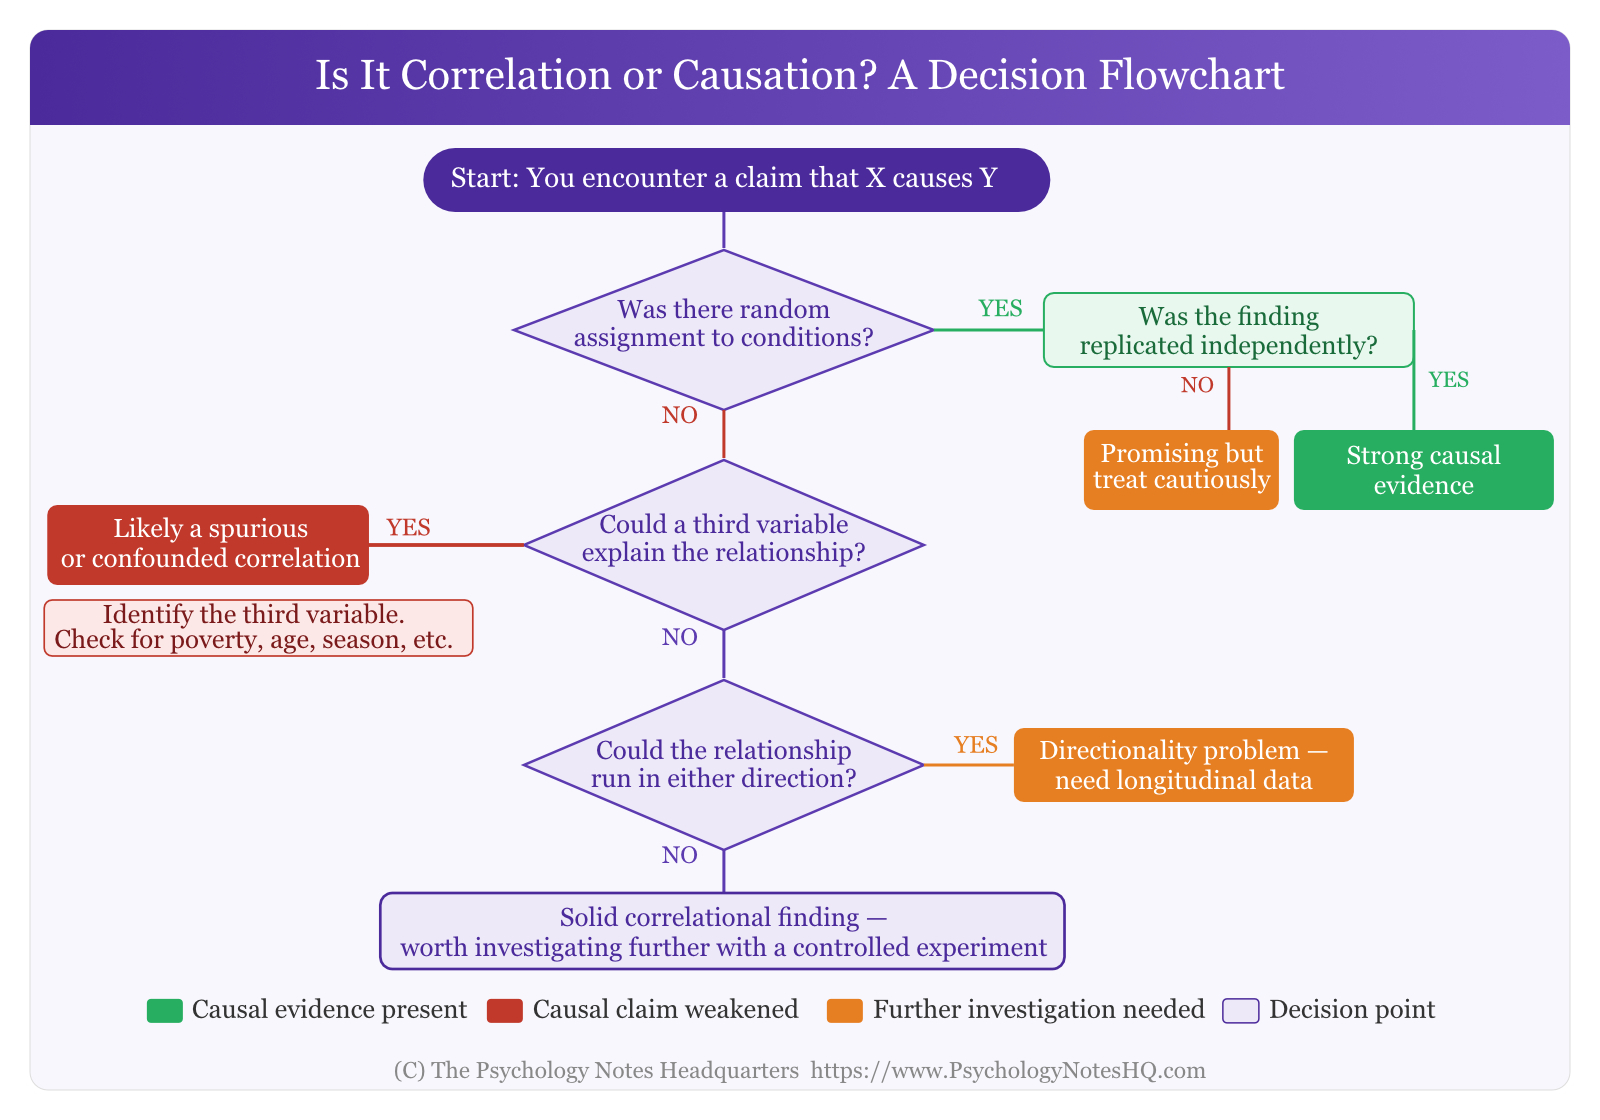
Recognising that correlation doesn’t imply causation raises a practical question: how do researchers establish that one thing actually causes another?
The gold standard is the randomized controlled experiment. Participants are randomly assigned to conditions, meaning pre-existing differences between groups are distributed by chance. This eliminates most third variables as alternative explanations for observed differences. The Milgram obedience experiments assigned participants to specific procedural conditions, allowing researchers to draw more defensible conclusions about the situational factors influencing obedience. Harlow’s attachment research with rhesus monkeys used controlled conditions — however controversial ethically — to isolate the variables driving attachment behaviour in ways that observational research simply could not.
Bandura’s work on observational learning similarly relied on experimental designs with random assignment to establish that watching aggressive behaviour caused increases in children’s own aggression — rather than simply correlating with pre-existing aggressive tendencies.
When random assignment is not possible — which is often the case in developmental or clinical psychology research — longitudinal designs offer the next best approach. If Variable A consistently precedes changes in Variable B, and not the reverse, that temporal pattern provides meaningful, though not conclusive, evidence for the direction of causality.
Replication matters enormously as well. A finding that appears in a single study, from a single laboratory, in a single population, should be treated with appropriate caution until it has been replicated across different settings, samples, and methodologies. The replication crisis in psychology over the past decade has underscored this point with considerable force: a correlation observed once, even a large one, is not reliable evidence of a robust phenomenon.
How to Spot Faulty Causal Claims in the Real World
Understanding these distinctions gives you a practical toolkit for evaluating research claims — in class, in journal articles, in news coverage, and in everyday conversation.
When you encounter the claim that X causes Y, a handful of pointed questions go a long way. Was this finding from a randomised experiment or an observational study? If observational, what are the most plausible third variables that might explain the relationship without any causal connection between X and Y? Has the finding been replicated, and by independent research groups? Who funded the study? Is the headline claiming more than the actual paper reports?
A particularly useful habit is to ask whether the relationship could reasonably run in the opposite direction. If a headline announces that a therapy reduces anxiety symptoms, consider whether people with lower baseline anxiety might also be more likely to enrol in and complete that therapy programme. If that reversal is plausible, you have identified a directionality problem that the study may not have adequately addressed.
None of this means dismissing every correlational finding as worthless. Correlational research is indispensable — it identifies relationships worth investigating, generates testable hypotheses, and documents real-world patterns that would be impossible to study experimentally. The point is not to demand a randomised controlled trial for every question in psychology. It is to carry a clear and honest understanding of what a correlation actually tells you, and to stay alert to the gap between what a study found and what is being claimed about it.
Conclusion
Understanding the difference between correlation and causation is not just a research methods checkpoint — it is one of the most practically transferable skills that comes out of studying psychology. Recognising the third variable problem, the directionality problem, and the way spurious correlations circulate through media and public discourse means you carry a genuine critical lens for evaluating health claims, social science findings, and the steady stream of data-based assertions that shape public belief. The next time a headline confidently tells you that X causes Y, you will know exactly which questions to ask — and why those questions matter.
References
- Bandura, A. (1997). Self-efficacy: The exercise of control. W. H. Freeman.
- Cohen, S., Janicki-Deverts, D., & Miller, G. E. (2007). Psychological stress and disease. JAMA, 298(14), 1685–1687. https://doi.org/10.1001/jama.298.14.1685
- House, J. S., Landis, K. R., & Umberson, D. (1988). Social relationships and health. Science, 241(4865), 540–545. https://doi.org/10.1126/science.3399889
- Pearl, J., & Mackenzie, D. (2018). The book of why: The new science of cause and effect. Basic Books.
- Twenge, J. M., & Campbell, W. K. (2018). Associations between screen time and lower psychological well-being among children and adolescents: Evidence from a population-based study. Preventive Medicine Reports, 12, 271–283. https://doi.org/10.1016/j.pmedr.2018.10.003
- Vigen, T. (2015). Spurious correlations. Hachette Books.
How to cite this article:
The Psychology Notes Headquarters. (2026). Correlation vs Causation: Real-Life Examples That Reveal the Difference. Retrieved from https://www.psychologynoteshq.com/correlation-vs-causation/